NetAtlas
🗺️ What it is:
NetAtlas is a Python engine that discovers the real, current shape of a Cisco network from the CDP and LLDP neighbour tables its devices already keep, renders it as a diagram and a Markdown inventory, commits the topology to git, and reports any device or link that has appeared or gone away since the approved baseline. Built and demonstrated on a GNS3 lab.
❓ The problem:
Network documentation is out of date the moment it is written — a link is re-patched, a switch is added, an access port is moved, and the diagram on the wiki still shows last quarter's network. Most small teams have no automated way to see what their network actually looks like right now, and no way to notice when it quietly changes.
⚙️ What it does:
• Polls each seed device for its CDP and LLDP neighbour detail and interface facts (Netmiko/SSH, or the console in the lab)
• Parses those neighbour tables into adjacencies, normalising interface names and hostnames so CDP and LLDP agree and each physical link is counted once
• Builds a graph of the whole network — including devices that were never in the inventory, which is exactly the gap stale documentation hides
• Renders a diagram (networkx + matplotlib) and writes a Markdown inventory and adjacency list, regenerated from scratch every run so they never go stale
• Commits the topology as a JSON baseline, and on later runs reports every added or removed device and link as drift
• Appends every run to an audit log
🧰 Tech stack:
• Device access — Netmiko (SSH); console for the GNS3 lab
• Neighbour data — CDP and LLDP (show ... neighbors detail)
• Graph model — networkx
• Diagram — matplotlib (Graphviz DOT also emitted)
• Version control — git (the topology baseline is committed)
• Lab build — GNS3 v2 REST API
Technical Stack
GNS3 lab topology (live canvas)
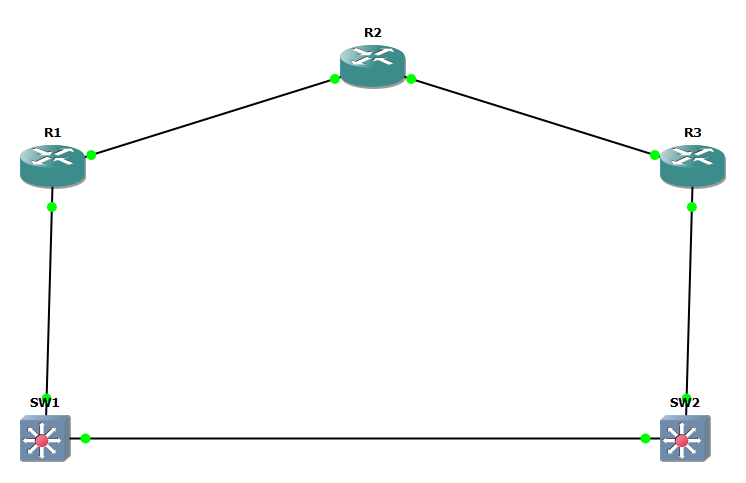
The actual GNS3 canvas — R1, R2 and R3 forming the core with SW1 and SW2 as access switches and a trunk closing the ring. Green links mean every device is running and connected. This is the emulated network NetAtlas discovers.
Live topology discovery
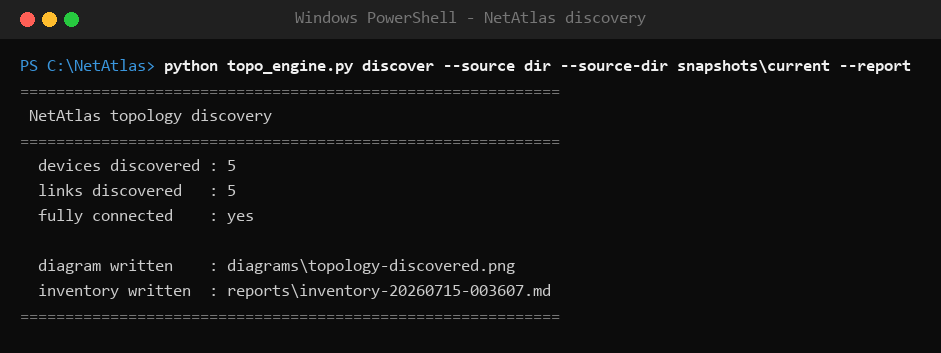
topo_engine.py reads each device's CDP/LLDP neighbour tables and reconstructs the network from scratch — five devices and five links, exactly matching the wiring, with nothing drawn by hand.
Auto-rendered diagram
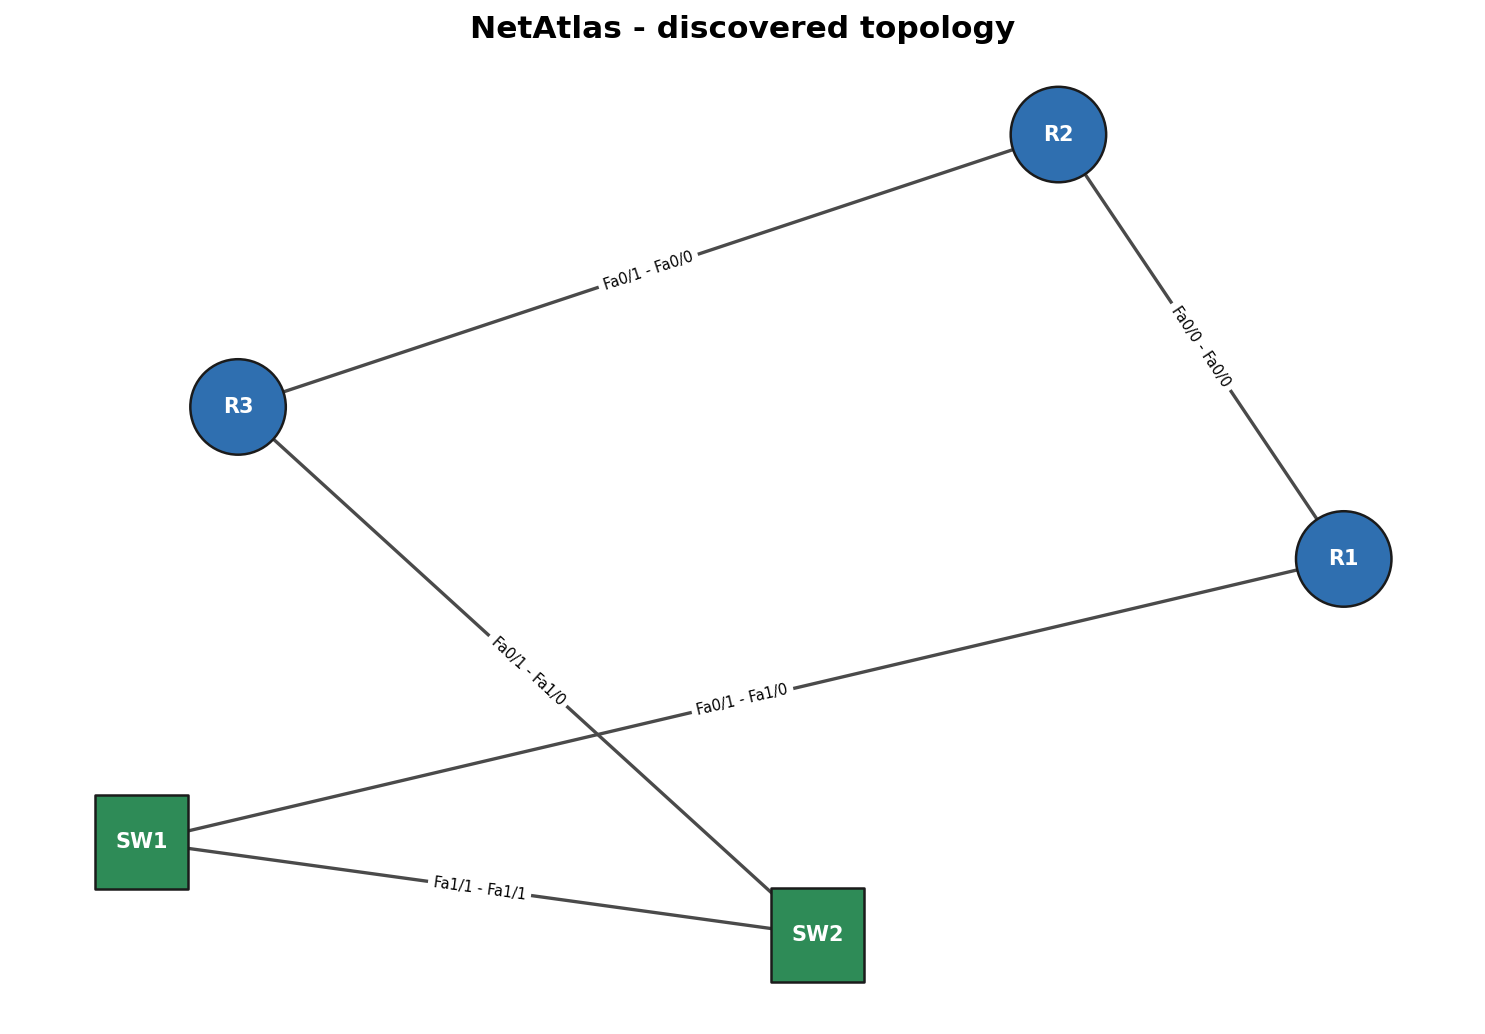
The diagram NetAtlas draws itself from the discovered graph — routers as circles, switches as squares, every link labelled with the port on each end. Regenerated every run, so it never goes stale.
Markdown inventory & adjacency list
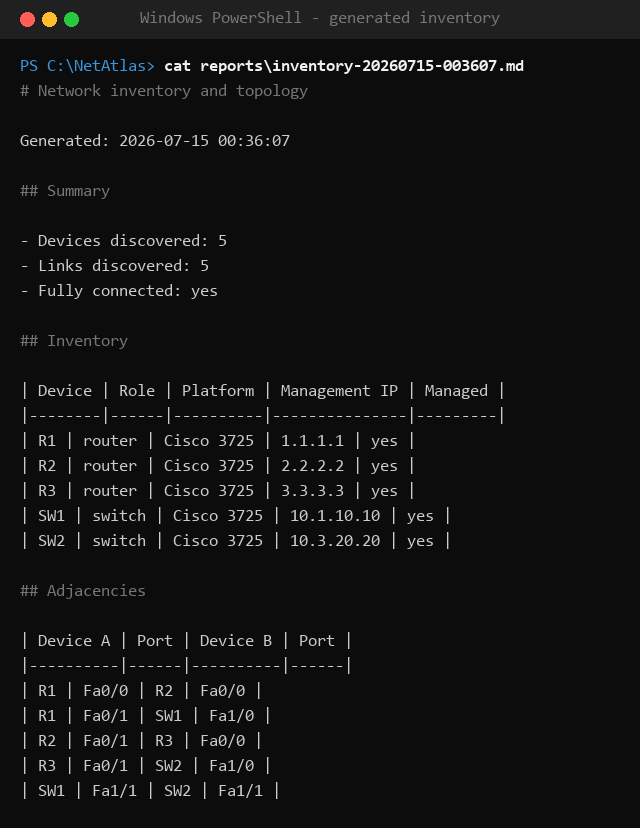
The same run writes a Markdown inventory and adjacency list — the living documentation that would otherwise be hand-maintained and out of date the moment a cable moves.
Baseline approved & committed
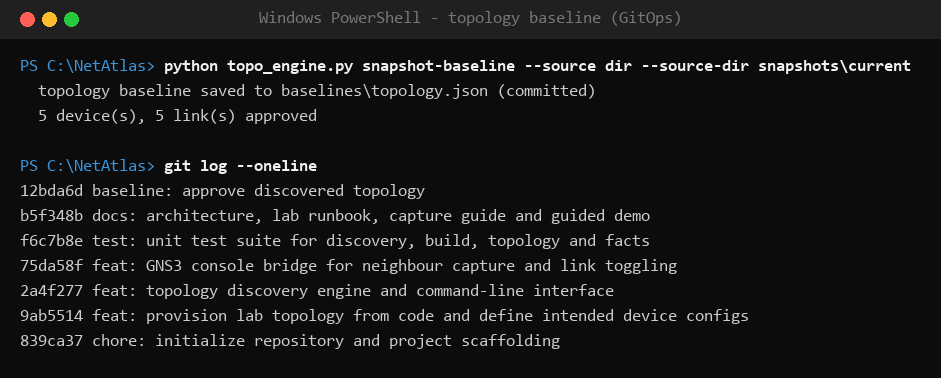
The discovered topology is approved as a JSON baseline and committed, so git holds the network's intended shape and every later run can be diffed against it.
Topology drift detected
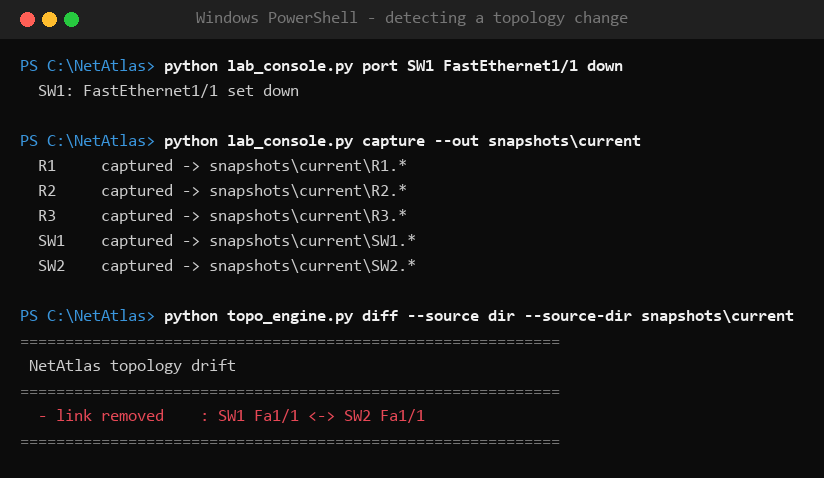
The trunk between SW1 and SW2 is taken down and the network is re-discovered; NetAtlas reports the missing SW1 <-> SW2 link as drift against the baseline, and appends the run to its audit log.
Test suite passing
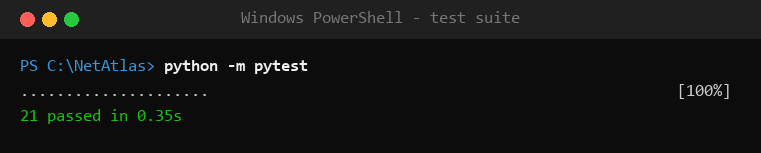
The suite covers CDP and LLDP parsing, interface and hostname normalisation, the CDP/LLDP merge, graph construction and health, snapshot round-tripping and the topology diff — all against fixtures, so no device is needed.